China has abundant river water resources, with an annual total river runoff ranking third globally, reaching an average of 2,700 billion cubic meters. However, rapid economic development has had some negative impacts on river water resources, with occasional incidents of river water pollution and eutrophication. Monitoring of 216 rivers across the seven major water systems in China, covering 503 main points, has revealed that Class I-III water quality accounts for 38%, Class IV-V accounts for 29.5%, and worse-than-Class V accounts for 32.5%. Therefore, analyzing and studying changes in river water quality and implementing protective measures are of great importance for improving water quality.
During routine surface water quality monitoring in a certain river channel, abnormal data were detected in a specific area. An investigation was conducted to identify the pollution sources responsible for the abnormal water quality in this river channel. Given the large scope of the water area under investigation and the requirement for depth-specific water sampling, the analysis primarily used an underwater Vehicle equipped with a multi-parameter water quality sensor to perform on-site water sampling and analysis. The collected data were directly uploaded to the Vehicle’s ground control station via a communication interface, improving the effectiveness of the monitoring results and meeting the quality control requirements of field sampling, thus ensuring the representativeness and timeliness of the samples. Based on literature research and field conditions, this study selected “four conventional parameters” [water temperature, dissolved oxygen (DO), turbidity, conductivity] as well as chlorophyll as water quality indicators. Additionally, a scanning sonar was used to dynamically observe the opening and closing of drainage outlet gates in real time to comprehensively analyze the causes of the water quality abnormalities.
Current Issue
The surface water monitoring data for a specific river area, as shown in Table 1, indicate that there is a noticeable difference in water quality indicator values between sampling points 1 and 2 in this area. Preliminary analysis suggests that there may be leakage from an existing drainage outlet, or there could be an unidentified drainage outlet within the river channel. To identify the source of this anomaly, further investigation and analysis were conducted in this study.
River Channel Survey Results
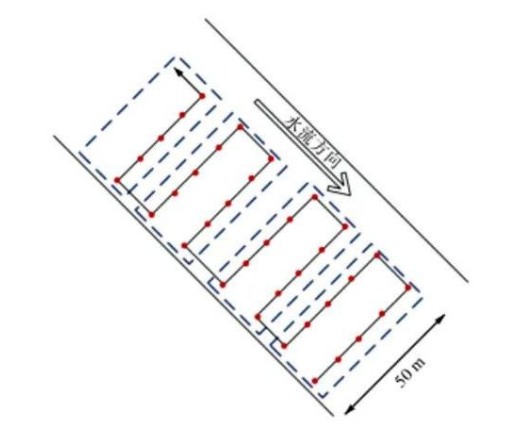
The water flow in this river channel is slow, making it suitable to employ underwater Vehicle for survey monitoring in a towed manner, balancing efficiency with monitoring effectiveness. The specific method is as follows: the underwater robot collects data every 10 meters along the survey area according to the trajectory shown in Figure 1, at the locations indicated by the dots (the river width is 50 meters). Sampling requirements are as follows: when the water depth is less than 5 meters, surfacewater samples are collected at a depth of 0.5 meters below the water surface. When the water depth exceeds 5 meters, mixed bottom water samples are taken from both 0.5 meters below the water surface and 0.5 meters above the river bottom. The final data for each location is determined by averaging the values over a continuous observation period of 30 seconds, once the data stabilizes.To ensure the authenticity and continuity of data collection, surveys are conducted on days without rainfall for consistent observation. Additionally, to enhance the reliability and validity of the measurement results, subsequent surveys cover an area extending 100 meters beyond the previous survey area, facilitating difference analysis and ensuring that no sampling omissions occur within the survey zone.
Tab.1 Surface water monitoring data of one river

River Channel Survey Results
The water flow in this river channel is slow, making it suitable to employ underwater Vehicle for survey monitoring in a towed manner, balancing efficiency with monitoring effectiveness. The specific method is as follows: the underwater robot collects data every 10 meters along the survey area according to the trajectory shown in Figure 1, at the locations indicated by the dots (the river width is 50 meters). Sampling requirements are as follows: when the water depth is less than 5 meters, surface water samples are collected at a depth of 0.5 meters below the water surface. When the water depth exceeds 5 meters, mixed bottom water samples are taken from both 0.5 meters below the water surface and 0.5 meters above the river bottom. The final data for each location is determined by averaging the values over a continuous observation period of 30 seconds, once the data stabilizes. To ensure the authenticity and continuity of data collection, surveys are conducted on days without rainfall for consistent observation. Additionally, to enhance the reliability and validity of the measurement results, subsequent surveys cover an area extending 100 meters beyond the previous survey area, facilitating difference analysis and ensuring that no sampling omissions occur within the survey zone.
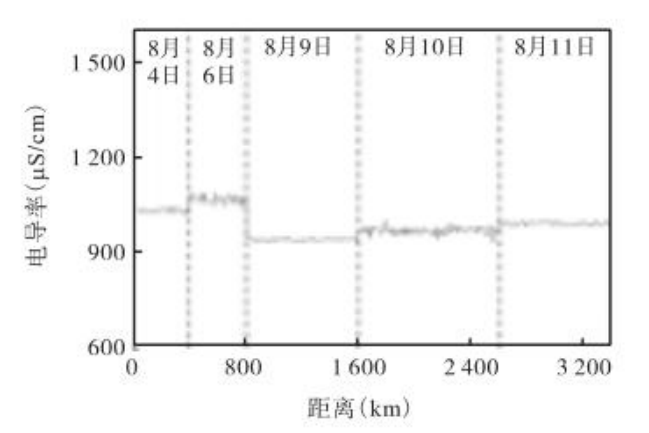
he towed survey began at the starting point of the river channel, collecting data every 10 meters over a total duration of 5 days. Continuous monitoring of water quality changes along the river was conducted, resulting in the collection of over 8,000 indicator data points.The variation in water conductivity data is shown in Figure 2. During the monitoring period with the underwater robot, the average conductivity of the water maintained around 1000 µS/cm, with only minor fluctuations in water quality. The conductivity readings showed no significant gradient changes, and no obvious anomalies were detected.
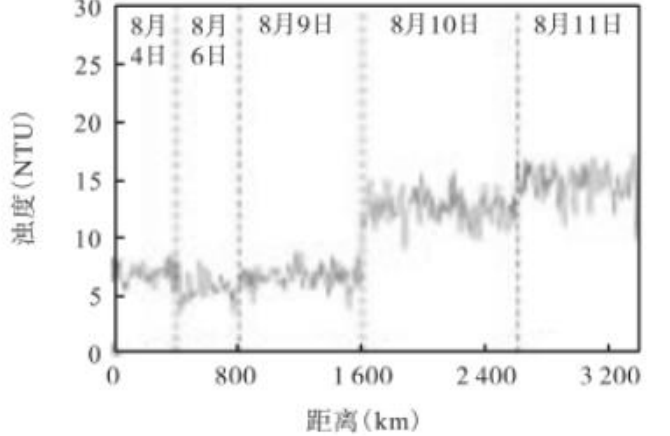
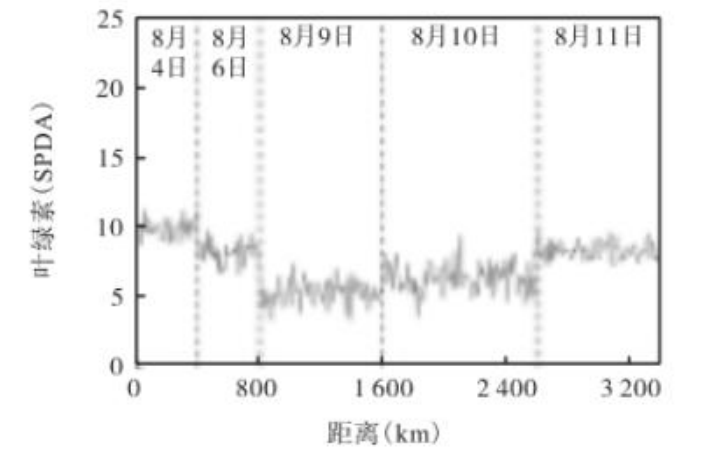
The changes in turbidity of the water samples during the towed monitoring survey are shown in Figure 3. Data analysis revealed that the average turbidity over the 5-day monitoring period was 9.3 NTU, indicating that the overall water quality remained consistent during the monitoring process. The turbidity readings exhibited minimal gradient changes, consistent with the characteristics of natural rivers, and no other significant anomalies were detected. The changes in chlorophyll levels in the water samples during the towed monitoring survey are illustrated in Figure 4. Real-time monitoring showed that the average chlorophyll level remained stable at 7.77 SPAD, with no noticeable abnormalities in water quality. The chlorophyll readings also demonstrated little to no gradient changes, and no other significant anomalies were observed during the monitoring process.
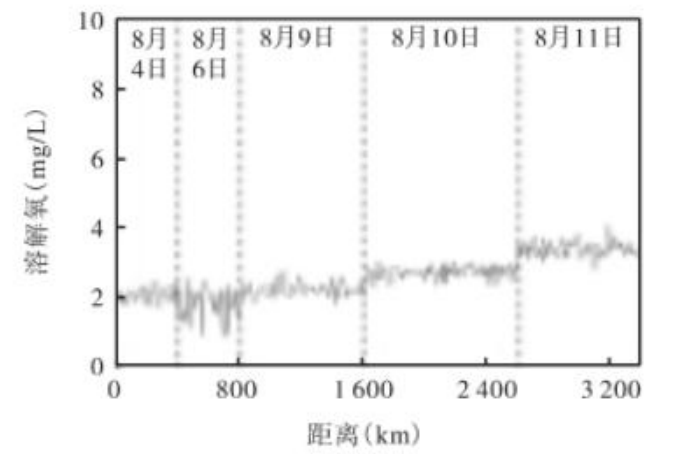
The trend of dissolved oxygen content in the water samples during the towed monitoring survey is shown in Figure 5. Data analysis indicates that the average dissolved oxygen concentration in the real-time collected water samples was approximately 2.49 mg/L. Throughout the monitoring period, the dissolved oxygen levels fluctuated without any noticeable anomalies. The dissolved oxygen readings exhibited minimal gradient changes,and no other significant anomalies were detected during the monitoring process.
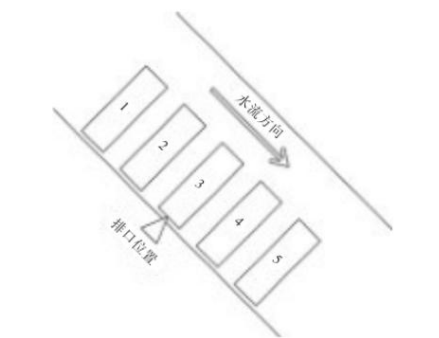
3 Investigation Results of River Discharge Outlets This river segment includes multiple discharge outlets, numbered from Outlet 1 to Outlet N,starting from the survey’s starting point. For the monitoring of these discharge outlets, a fixed-point monitoring approach was employed. The outlet locations were divided into five sampling areas, centered around the outlets and spaced 5 meters apart in the direction of the water flow, numbered from upstream to downstream as Positions 1, 2, 3, 4, and 5, as shown in Figure 6. Underwater Vehicle equipped with multi-parameter water quality sensors were used to monitor real-time water quality indicators such as conductivity, dissolved oxygen, turbidity,and chlorophyll. Additionally, scanning sonar was utilized to dynamically analyze the opening and closing of the outlet gates. For the conditions inside the outlets, water samples were taken as close as possible to analyze water quality. If significant leakage from the gates is ruled out, a grid observation network with 10-meter intervals can be established around the outlet. Water samples will be collected at a depth centered on the outlet, using the underwater robot for rapid fixed-point monitoring. Data will be collected at the intersection points of the horizontal and vertical grids, with the final value determined as the average over a continuous observation period of 30 seconds once the data stabilizes. The results will be analyzed and confirmed to assess the potential for slow leaks.
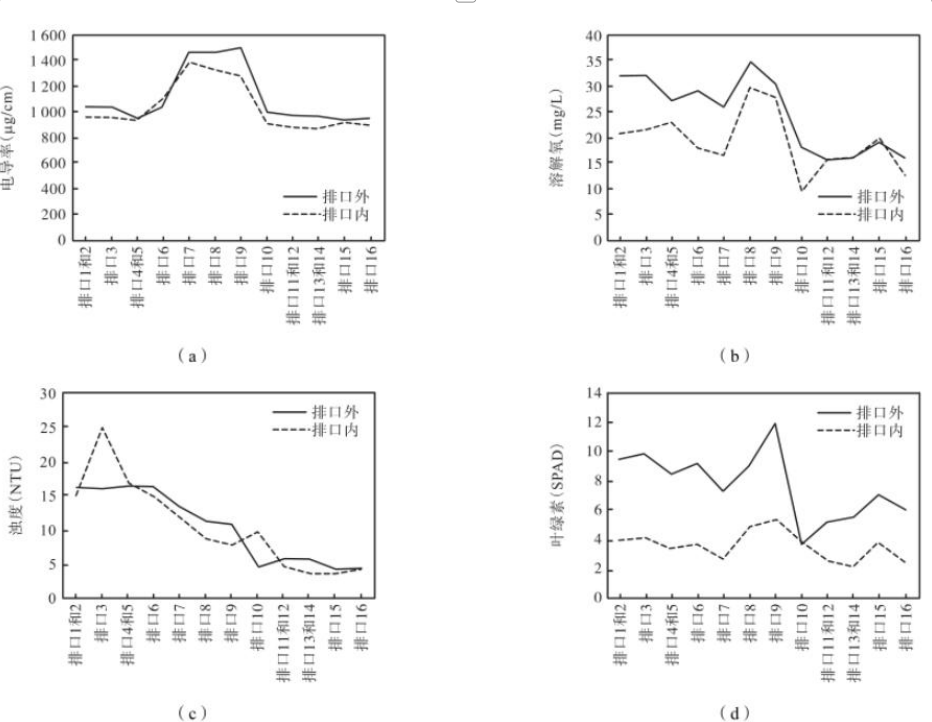
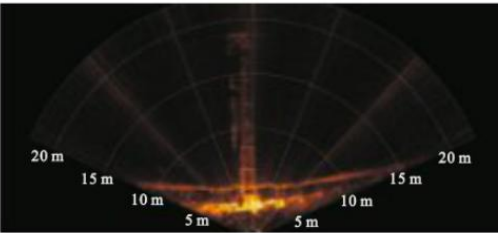
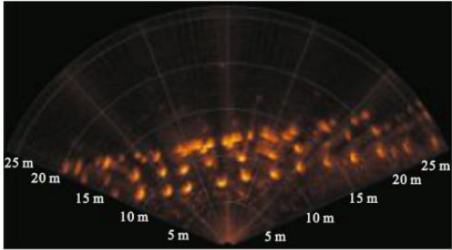
The fixed-point monitoring of water quality differences is illustrated in Figure 7. The data indicates that there are no significant anomalies in the conductivity, turbidity, dissolved oxygen, and chlorophyll levels of the water samples. However, there are observable differences in water quality between the inside and outside of the discharge outlets, with water quality inside the outlets generally being slightly better than outside. During the monitoring process, sonar analysis revealed that the gates of Outlet 4, Outlet 5 (which shares a gate), and Outlet 10 were in the open position, as shown in Figures 8 and 9,while all other outlets were closed. Comparing the water conditions at Outlet 4 and Outlet 5,it was noted that the conductivity at these outlets was lower, while turbidity was higher. This suggests that the discharged water likely has a low metal salt content but higher turbidity, indicating a possible mixture of stormwater and sewage, which could lead to abnormal water quality data. In contrast, at Outlet 10, both conductivity and turbidity were low, while dissolved oxygen levels were high, indicating that rainwater was likely being discharged, which aligns with the discharge requirements.
Conclusion The towed water quality monitoring survey found no evidence of unidentified outlets or abnormal pollution sources underwater. The fixed-point water quality monitoring indicated that there may be a mixture of stormwater and sewage at Outlet 4 and Outlet 5 (which share a single outlet). Other locations were not in a drainage period, making specific analysis temporarily unavailable. To ensure the quality of surface water in the river and maintain a healthy ecological environment, it is recommended to implement continuous recording and dynamic monitoring of the river to achieve ongoing prevention of water resource pollution.
